Note
Go to the end to download the full example code
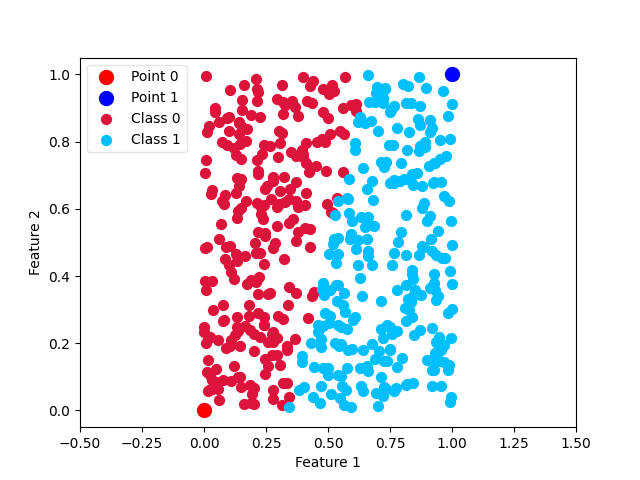
Plotting Template Classifier
An example plot of skelm.template.TemplateClassifier
import numpy as np
from matplotlib import pyplot as plt
from skelm import ELMClassifier

X = [[0, 0], [1, 1]]
y = [0, 1]
clf = ELMClassifier()
clf.fit(X, y)

rng = np.random.RandomState(13)
X_test = rng.rand(500, 2)
y_pred = clf.predict(X_test)

X_0 = X_test[y_pred == 0]
X_1 = X_test[y_pred == 1]


p0 = plt.scatter(0, 0, c='red', s=100)
p1 = plt.scatter(1, 1, c='blue', s=100)

ax0 = plt.scatter(X_0[:, 0], X_0[:, 1], c='crimson', s=50)
ax1 = plt.scatter(X_1[:, 0], X_1[:, 1], c='deepskyblue', s=50)

leg = plt.legend([p0, p1, ax0, ax1],
                 ['Point 0', 'Point 1', 'Class 0', 'Class 1'],
                 loc='upper left', fancybox=True, scatterpoints=1)
leg.get_frame().set_alpha(0.5)

plt.xlabel('Feature 1')
plt.ylabel('Feature 2')
plt.xlim([-.5, 1.5])

plt.show()
Total running time of the script: ( 0 minutes 0.184 seconds)